
What is a Summary Panel?
The ESU Summary Panel is a customisable live reporting tool for Jira. The data is live because it's not cached, it’s calculated using a live reporting algorithm.
Summary Panels provide a single view for data visualization related to your project. It is on the Summary Panel where users can view which projects are on track, at risk, overtime or outside the budget, at a glance.
No more clicking into single work items to see what is happening inside an epic. Summary Panels solve the “too many clicks” problem for project managers and product managers who manage projects in Jira.
What’s viewable on ESU Summary Panels
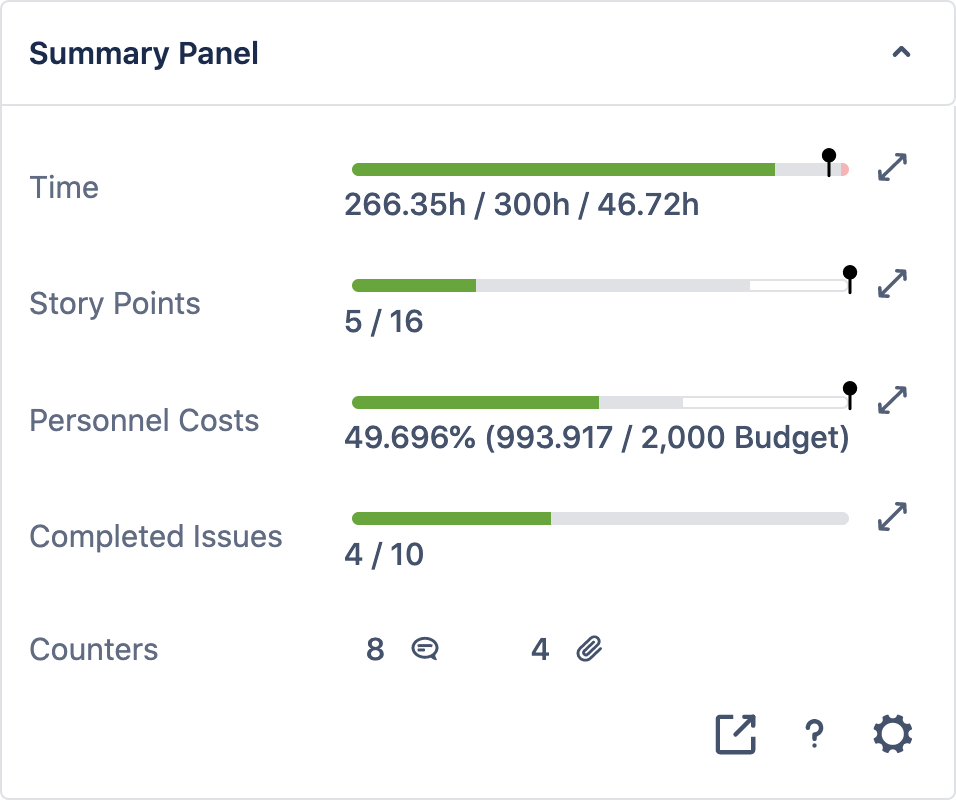
On the standard Summary Panel view users will have full visibility of all progress bars and summary counters.
Some examples of progress bars include
-
time
-
story points
-
completed work items
To learn more about progress bars and summary counters click here.
Summary Panel configuration
Summary Panels can be configured to individual work items, spaces and global work types. Learn more about Summary Panel configuration here.
Once your issue and Summary Panels are configured ESU will automatically generate data visualizations based on your settings.